Fully Actionable Intent Data
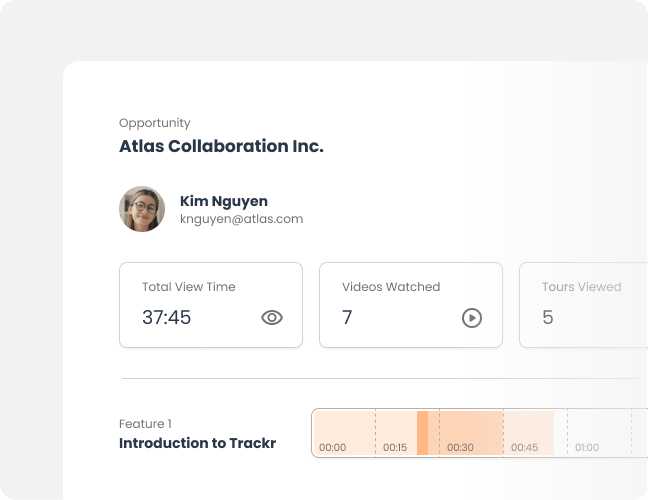
Consensus’ industry-leading engagement data helps you discover critical stakeholders, understand their buying intent signals, identify buying groups, and help them align.
Finally, truly actionable intent data that brings you faster close times, bigger deals, and higher close rates.